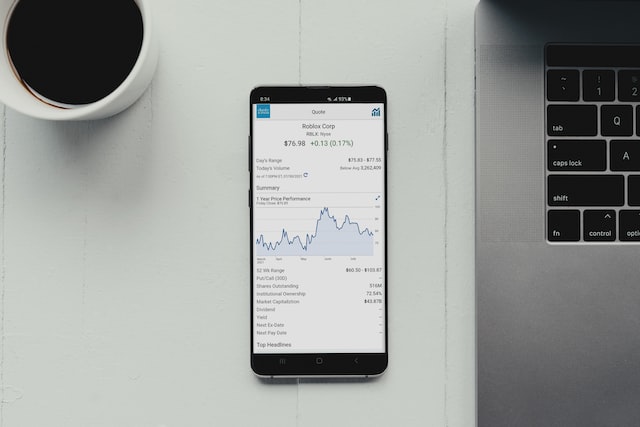
When it comes to analysing a security’s bull and bear power as a trader or investor, you need to evaluate volume indicators, which is an essential technical parameter that many beginner traders tend to overlook. When technical analysis is concerned, volume plays a significant role that helps to confirm trends and patterns in the market. Volume indicators also tell how many stocks were purchased and sold in the market at a certain time.

While the usability of volume indicators is significant in the stock market, there are different types of volume indicators to consider when reading the market effectively. But before we jump into that, let’s take a quick look at what high volume and low volume mean in the market and what their importance is.
High-volume in the stock market
In the stock market, high volume indicates that investors and traders are taking more interest, which, in short, means increased numbers of buyers and sellers in that stock. A stock in an uptrend with an increase in volume indicates that the stock will continue to surge. Similarly, when the stock is in a downtrend with an increase in volume, this indicates the opposite, meaning the stock will continue to drop.
Low-volume in stock market
On the other hand, when a stock is in an uptrend with low volume, it indicates that the trend is going to reverse as the number of interested buyers has reduced, and vice versa.
Now that we have uncovered the importance of high and low volume, let’s look at some of the common types of volume indicators.
- On-balance volume
On-Balance Volume (OBV), created in 1963 by Joseph Granville, is one of the most preferred accumulation-distribution indicators that helps in calculating buying and selling pressure. This means that the indicator helps sum up volume on good days and decrease volume on bad days. The OBV indicator creates a bullish divergence when it is rising and the market price is falling. Similarly, OBV generates a bearish divergence when IBV is falling and the market price is rising.
- Volume RSI
Volume Relative Strength Index, or RSI, is another volume indicator that is similar to RSI except that instead of using changes in price in the RSI formula, here up-volume and down-volume are used. The indicator oscillates around the 50% centerline in the 0–100% range. Traders can use this indicator to trade on the signals generated by the crossovers of the volume RSI along with the 50% center line around which the indicator oscillates.
- Accumulation-Distribution
The next volume indicator on our list is A/D, or accumulation-distribution, which is a cumulative volume indicator where each data point is added to the data point that comes before that prior to being plotted on an indicator panel. As the name suggests, this indicator helps determine whether a security is being distributed or accumulated.
- Chaikin Money Flow Indicator
This indicator assists in measuring the amount of MFV, or Money Flow Volume over a specific period. Created in the early 1980s, this indicator is used to analyse and measure the A/D of a security over time. Typically valuing from +100 to -100 with a zero line that indicates a neutral state (neither accumulation nor distribution), CMF tends to fluctuate above or below the indicator like an oscillator.
- Balance of Power
Last but not least is BOP, or “balance of power,” which helps measure the strength of buying and selling pressure. The calculation is usually smoothed by a moving average, or specifically, a 14-period moving average.
Conclusion
Volume indicators are an essential technical parameter to consider when you are trading stocks. As there are a number of indicators available, make sure you study them thoroughly in order to improve your trading in the long run.
Must Read: Technical Indicators for Stocks
*Cordly.io does not offer financial advice, sell any financial products, or encourage to invest in specific assets or instruments.*


 All Blogs